Know what actually works.
Track your data, measure real effects, and prove whether your routines are making a difference — in days, not months.
No setup · Works in minutes
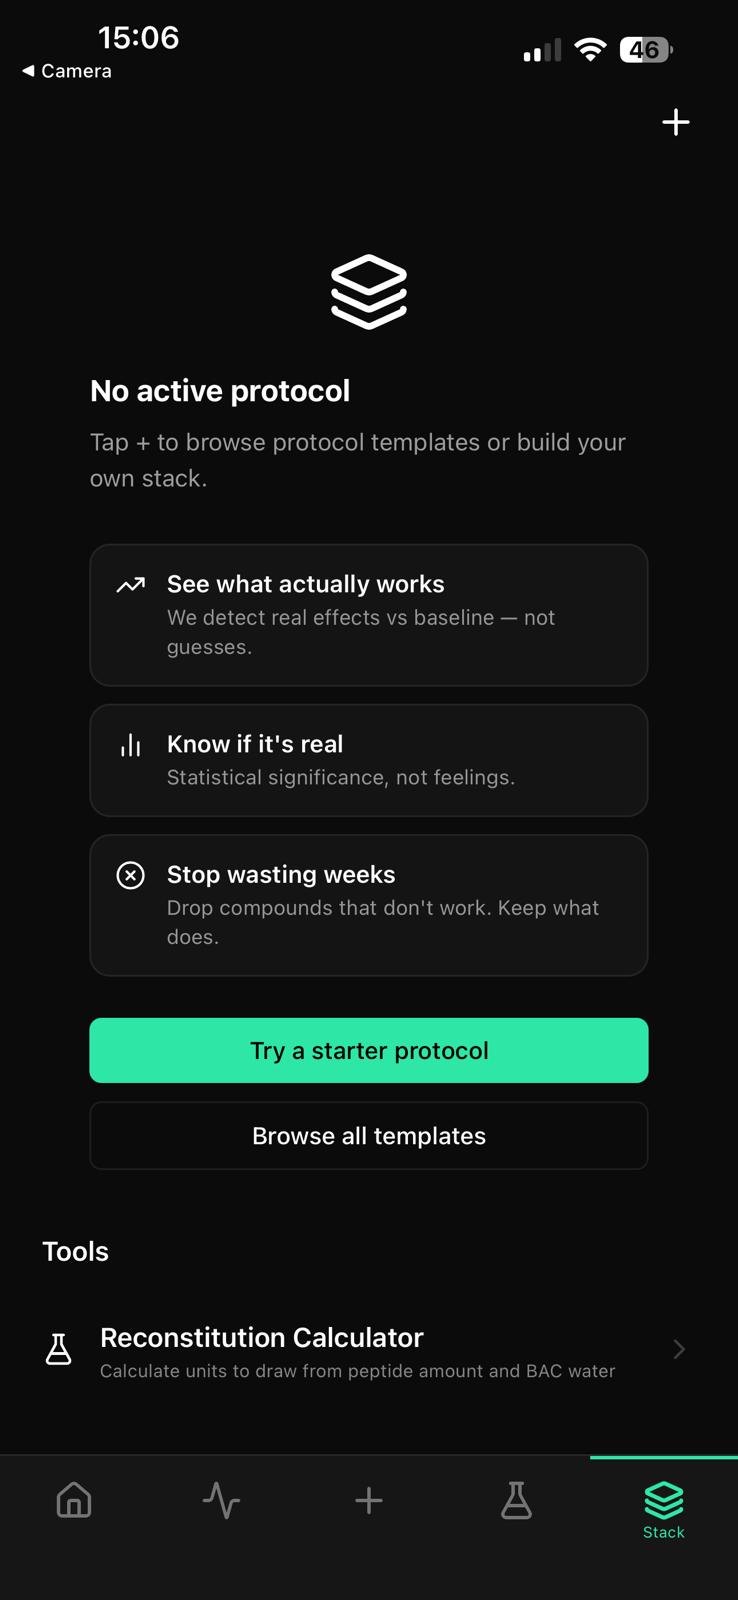
Three things most apps won't tell you.
See what actually works
Detect real effects vs your baseline — not guesses.
Know if it's real
Statistical validation built into your tracking.
Stop wasting weeks
Drop what doesn't work. Keep what does.
Simple process. Real proof.
Track → Analyze → Prove.
Log routines and sync data
Log your routines and sync your wearable data in seconds.
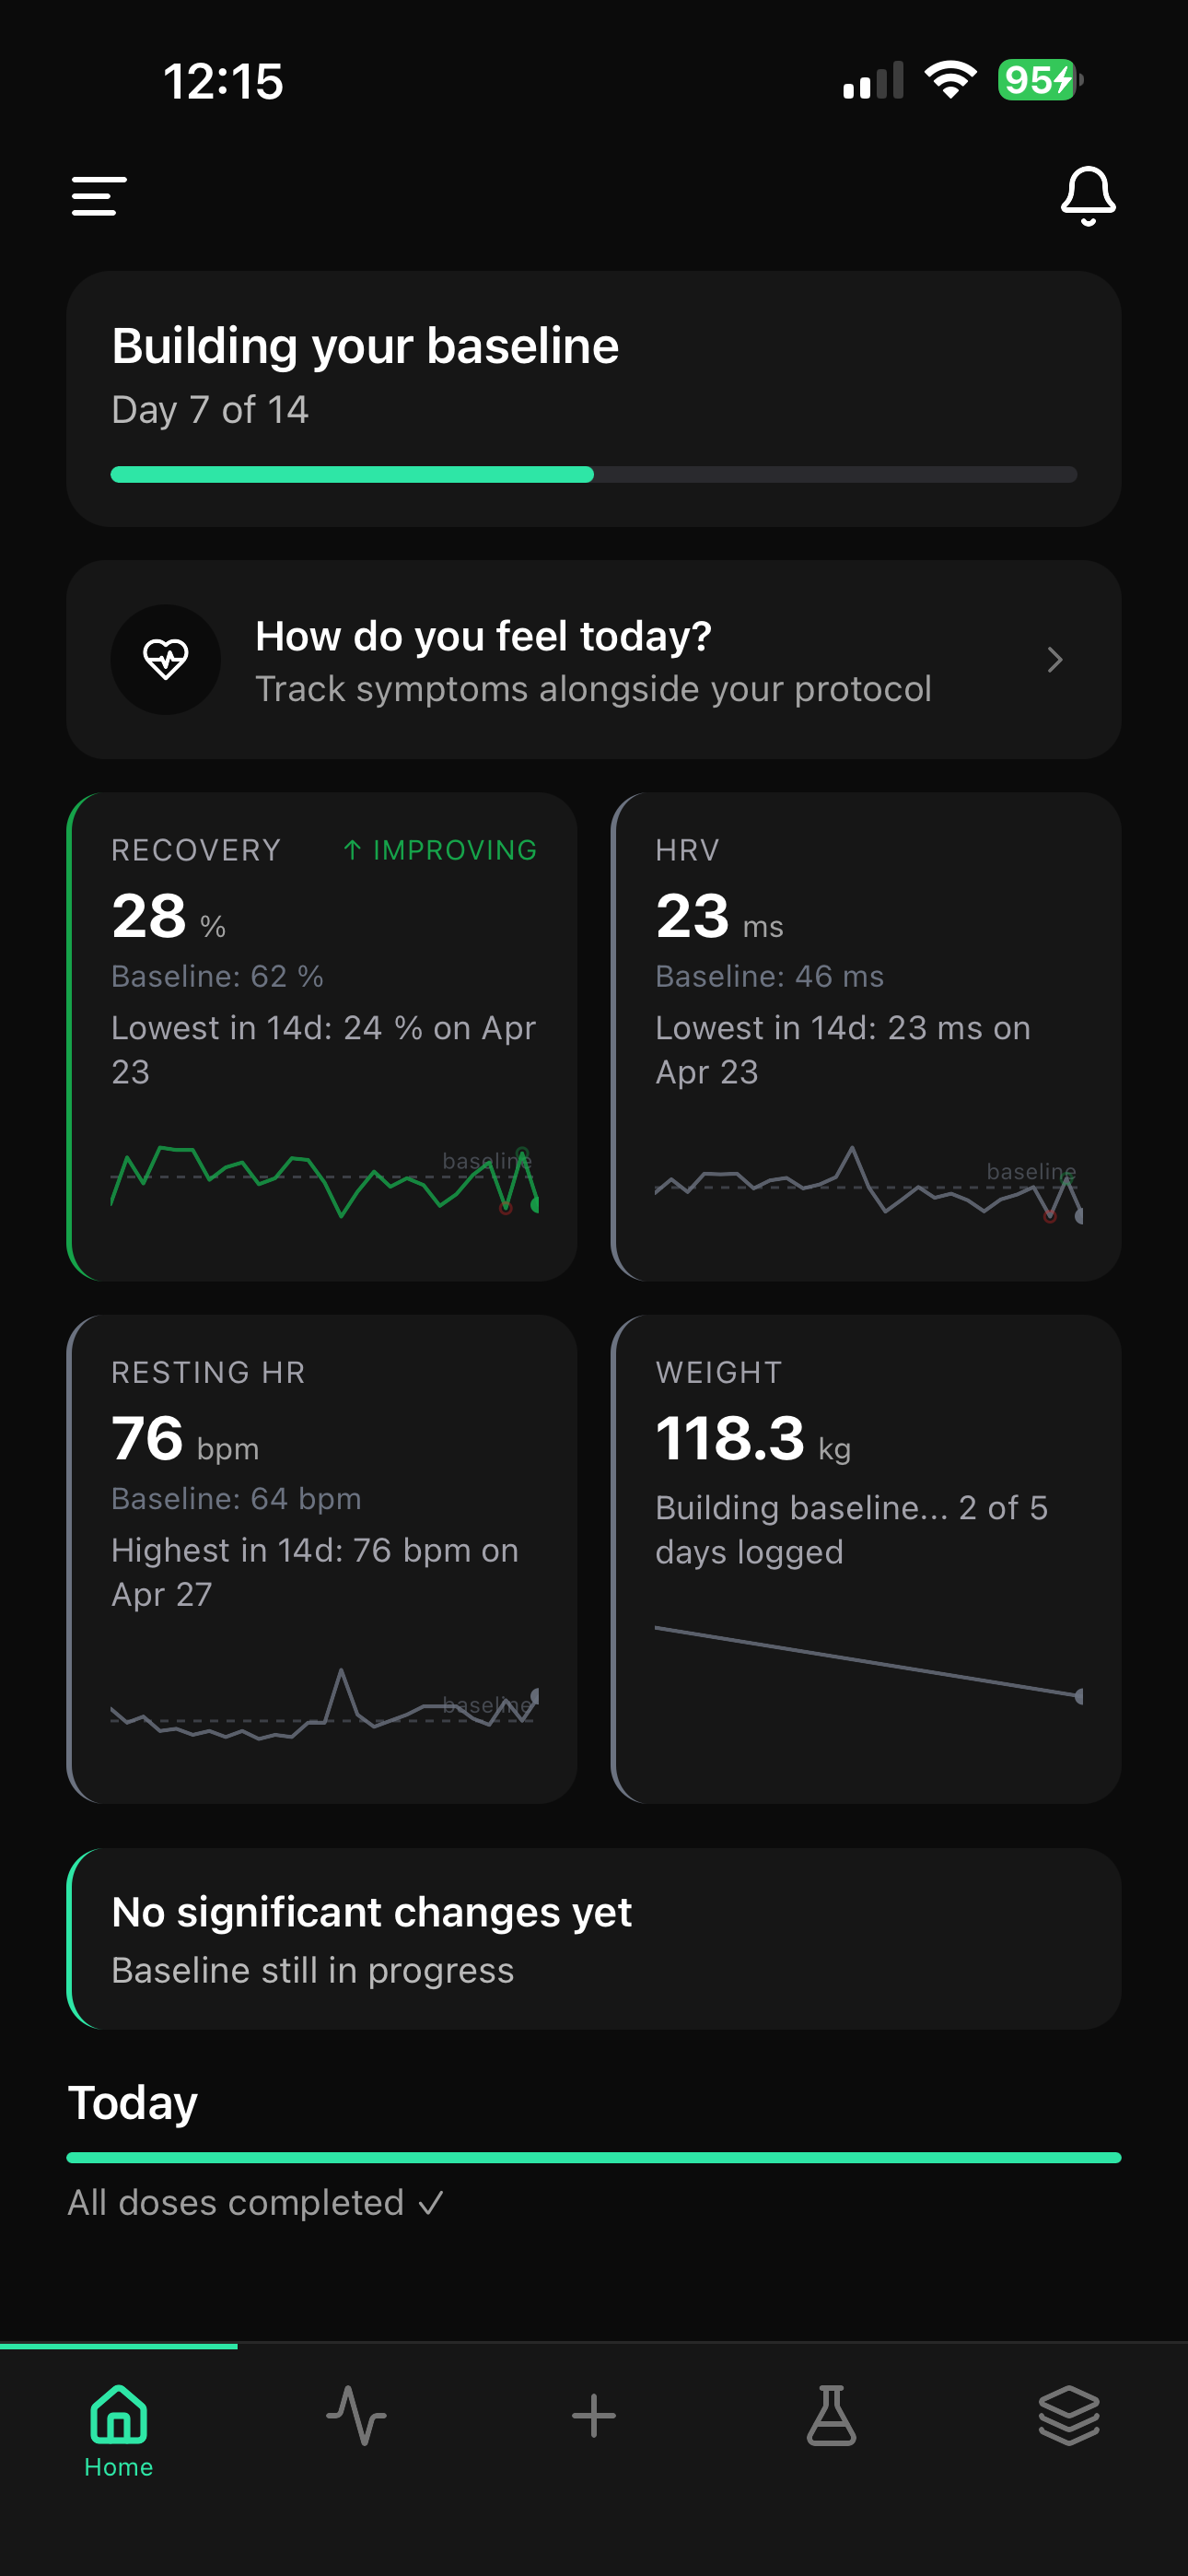
Build baseline across HRV, recovery
We build your baseline and monitor changes across HRV, recovery, and more.
Statistical validation shows results
Statistical validation shows whether the effect is real.
Your body, in real data.
HRV, recovery, heart rate and trends — all in one place.
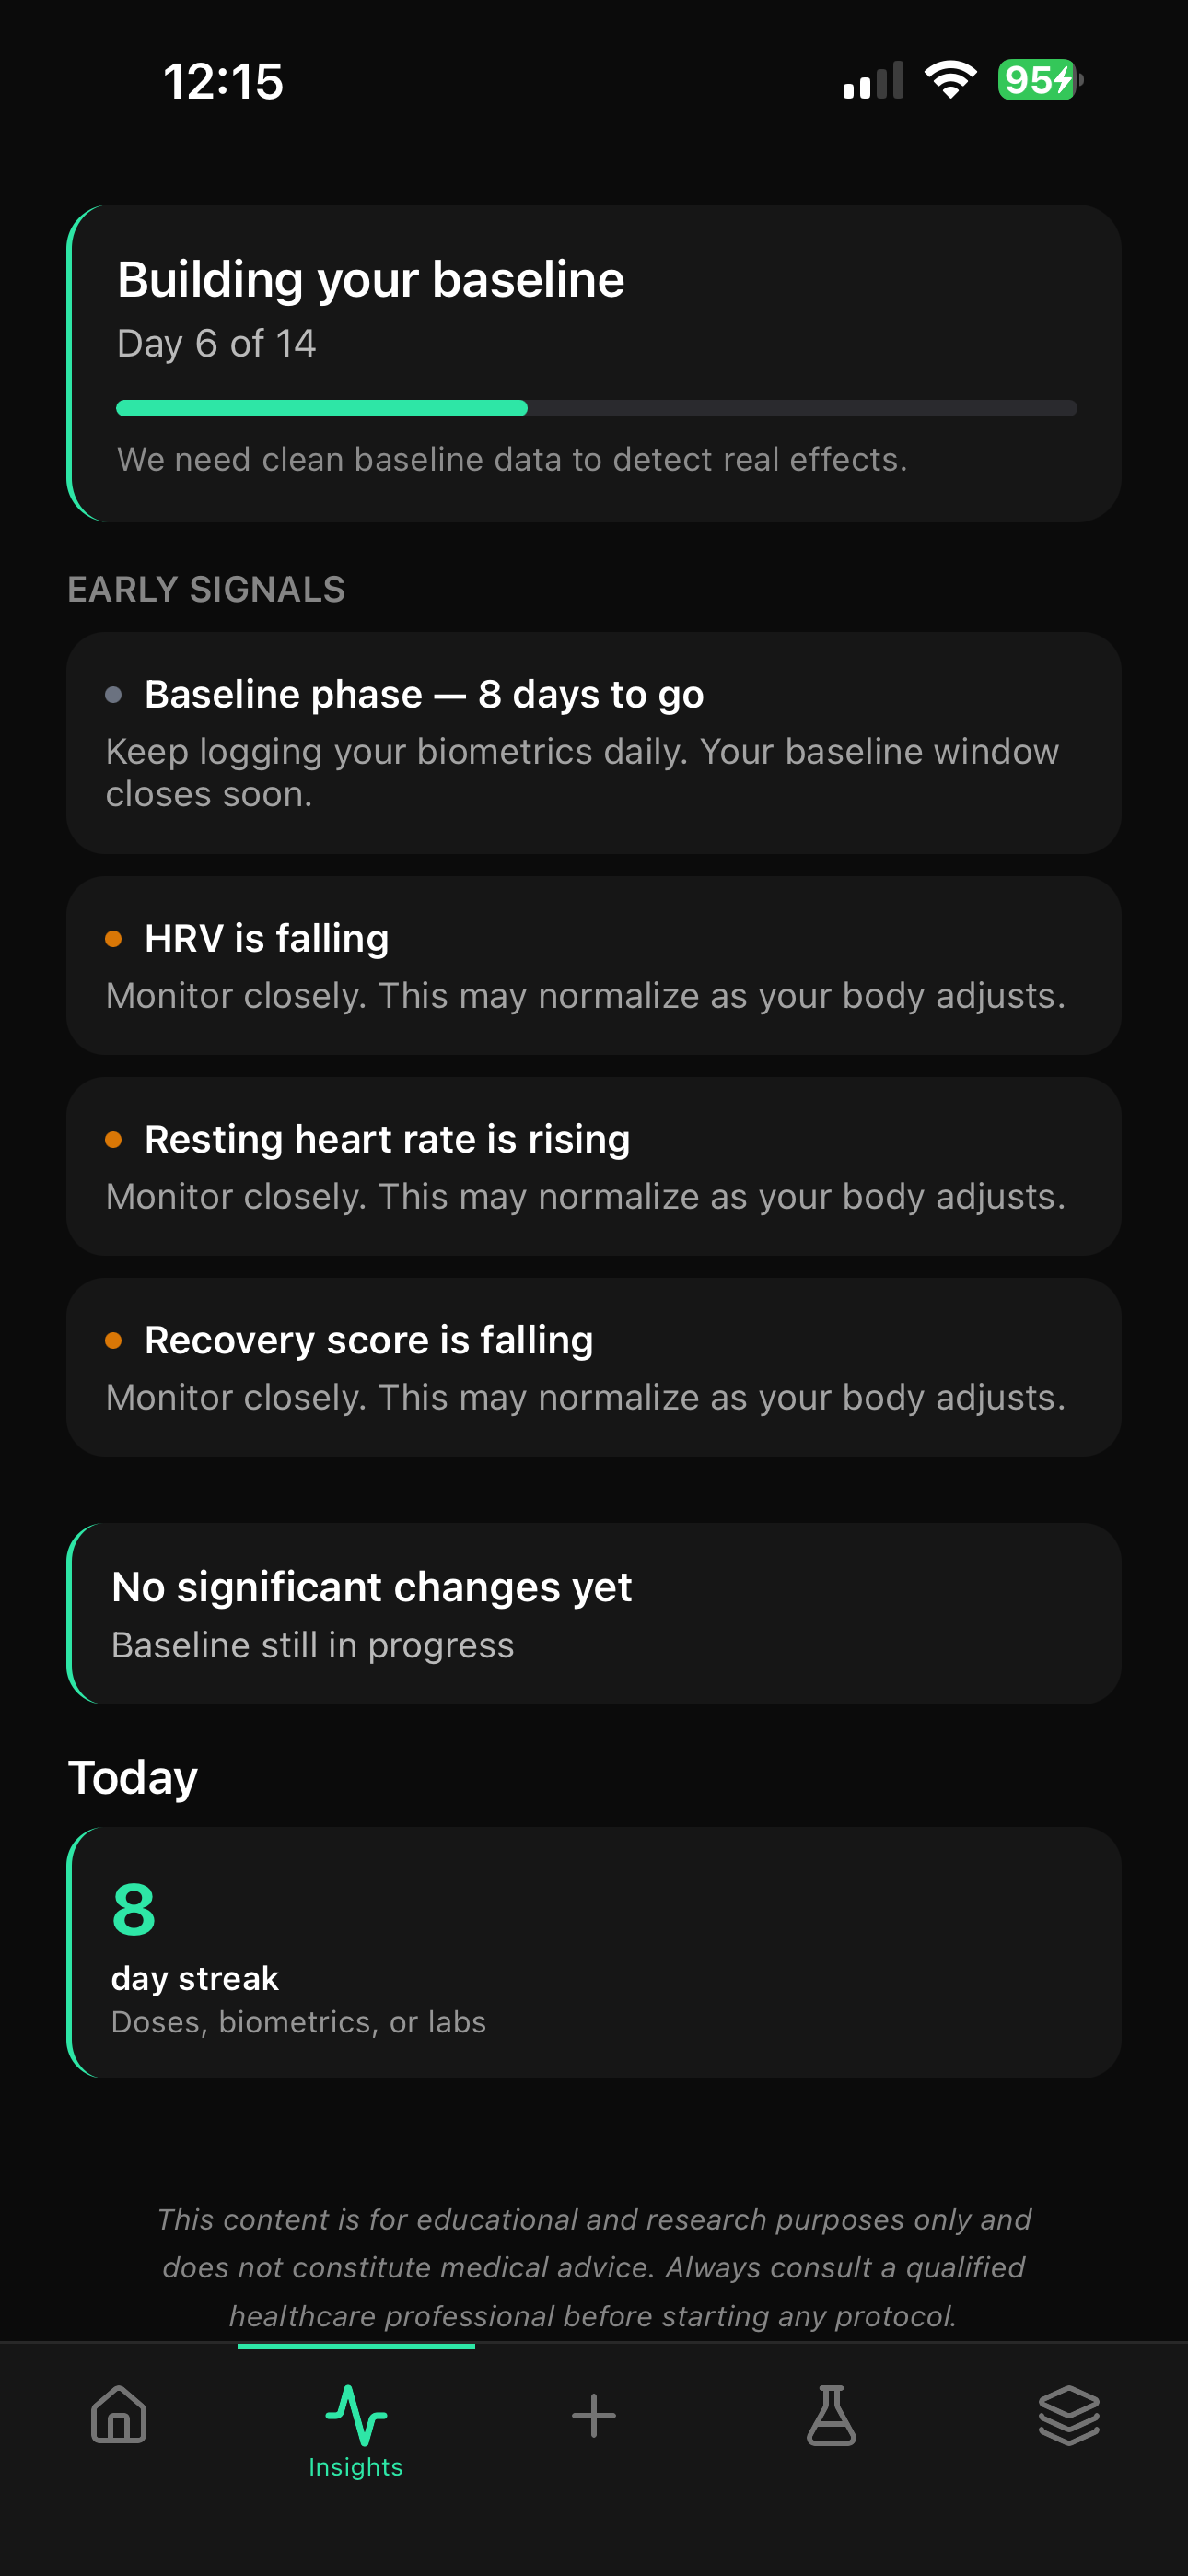
Detect real changes early.
Know when your body starts responding — before you feel it.
- Early signal detection
- Baseline drift tracking
- Daily trend awareness
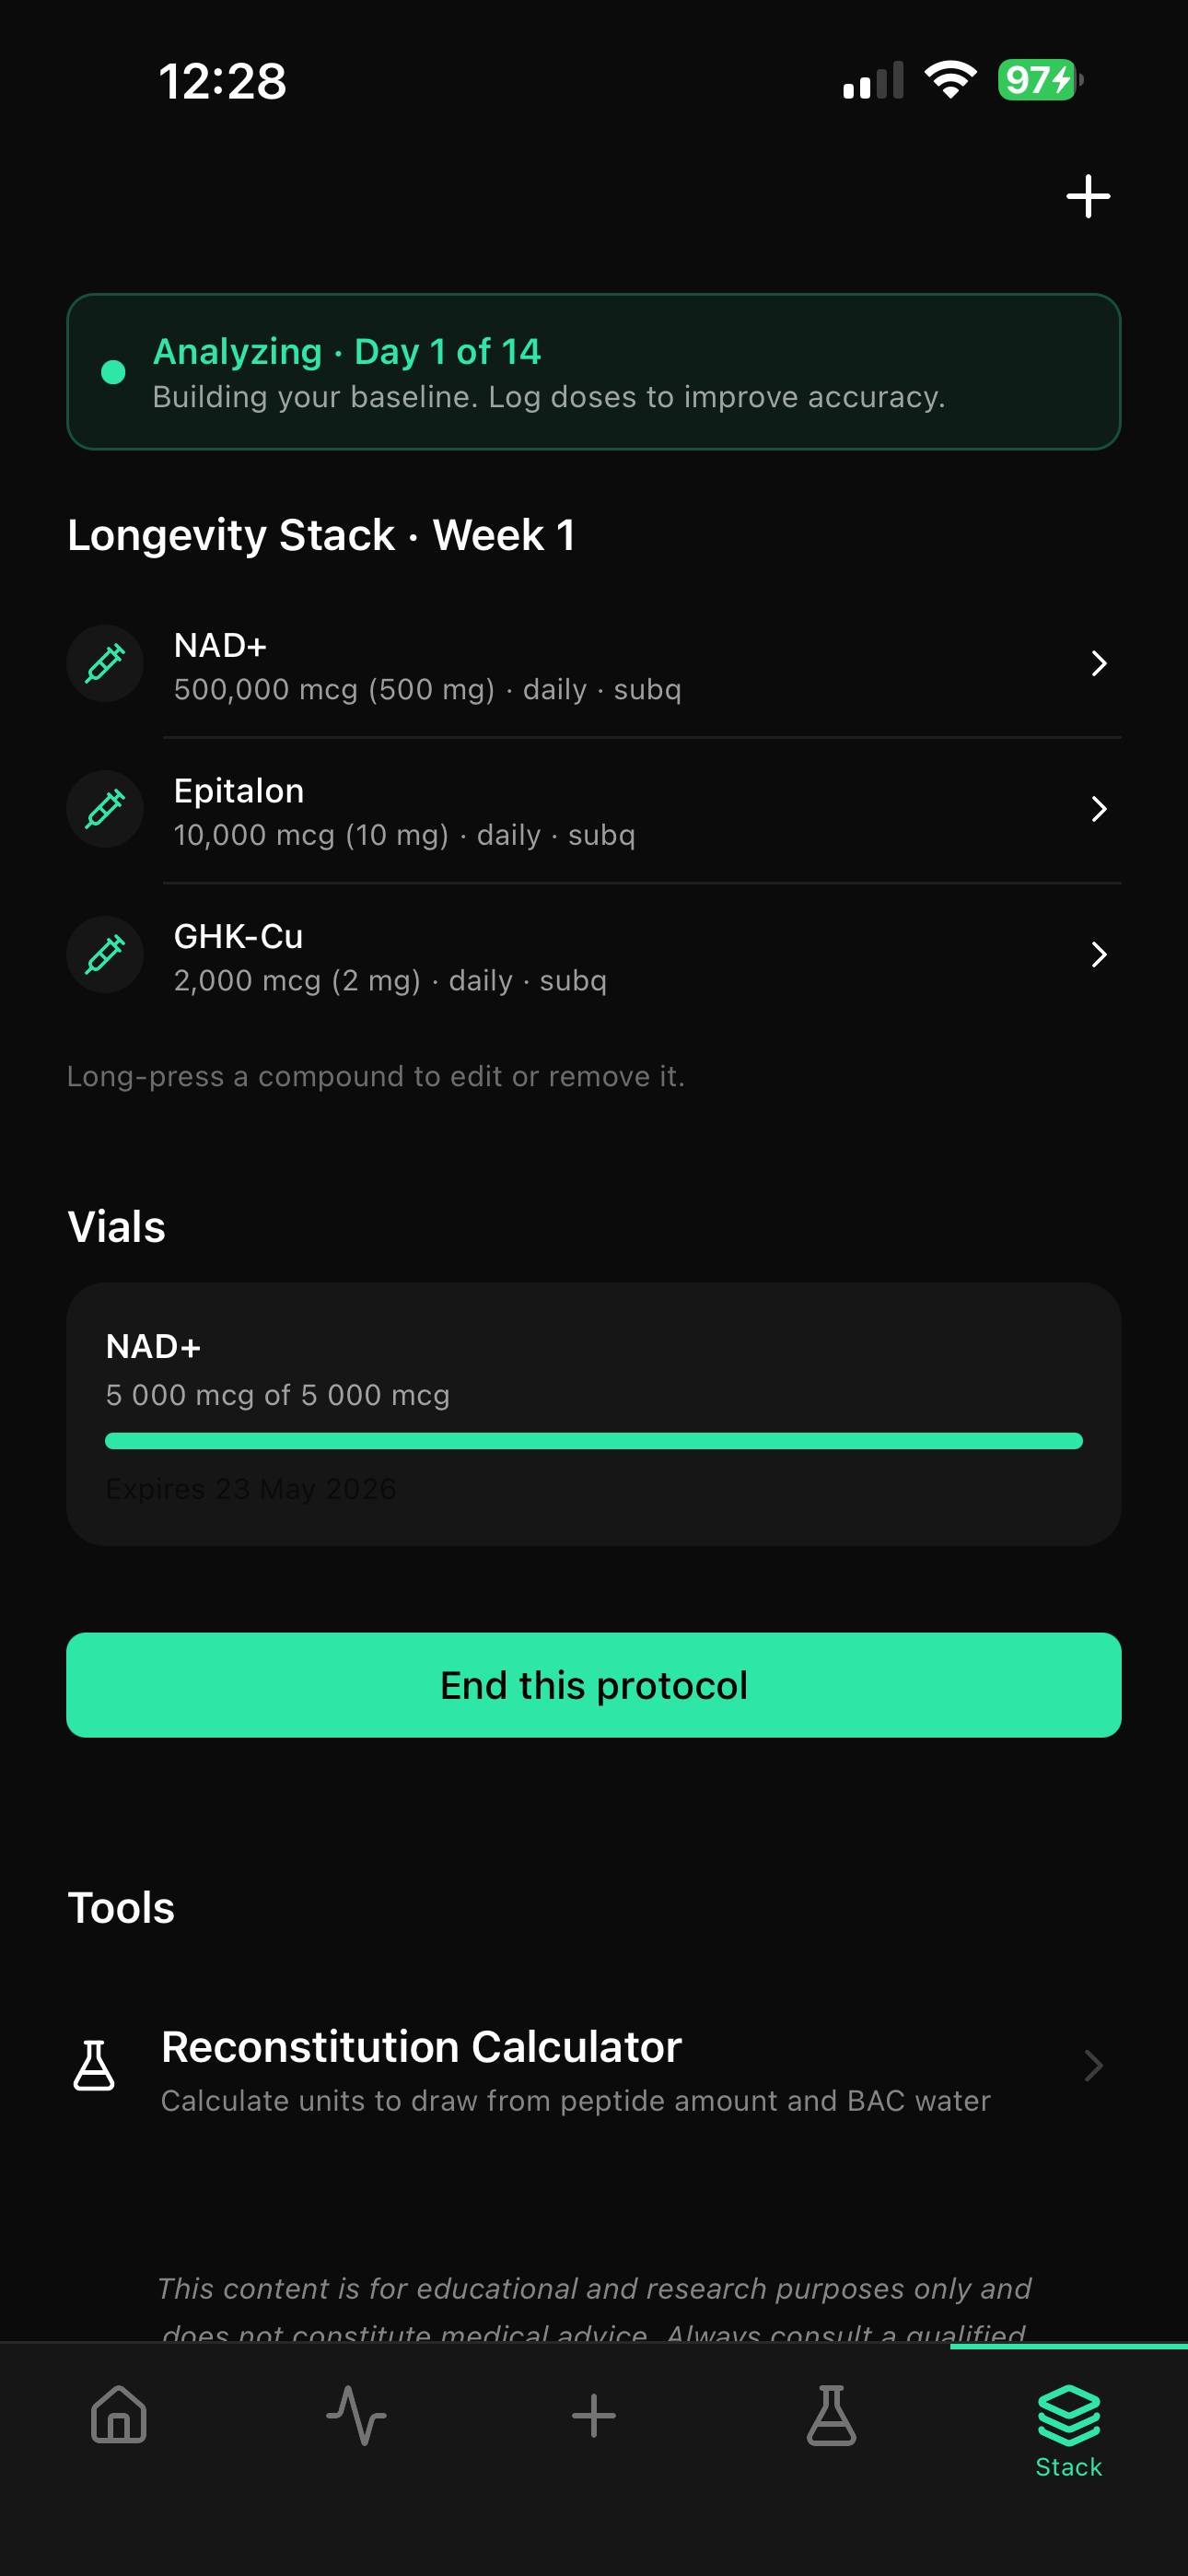
Track your protocol daily.
Log routines, stay consistent, and monitor progress over time.
Not tracking. Proof.
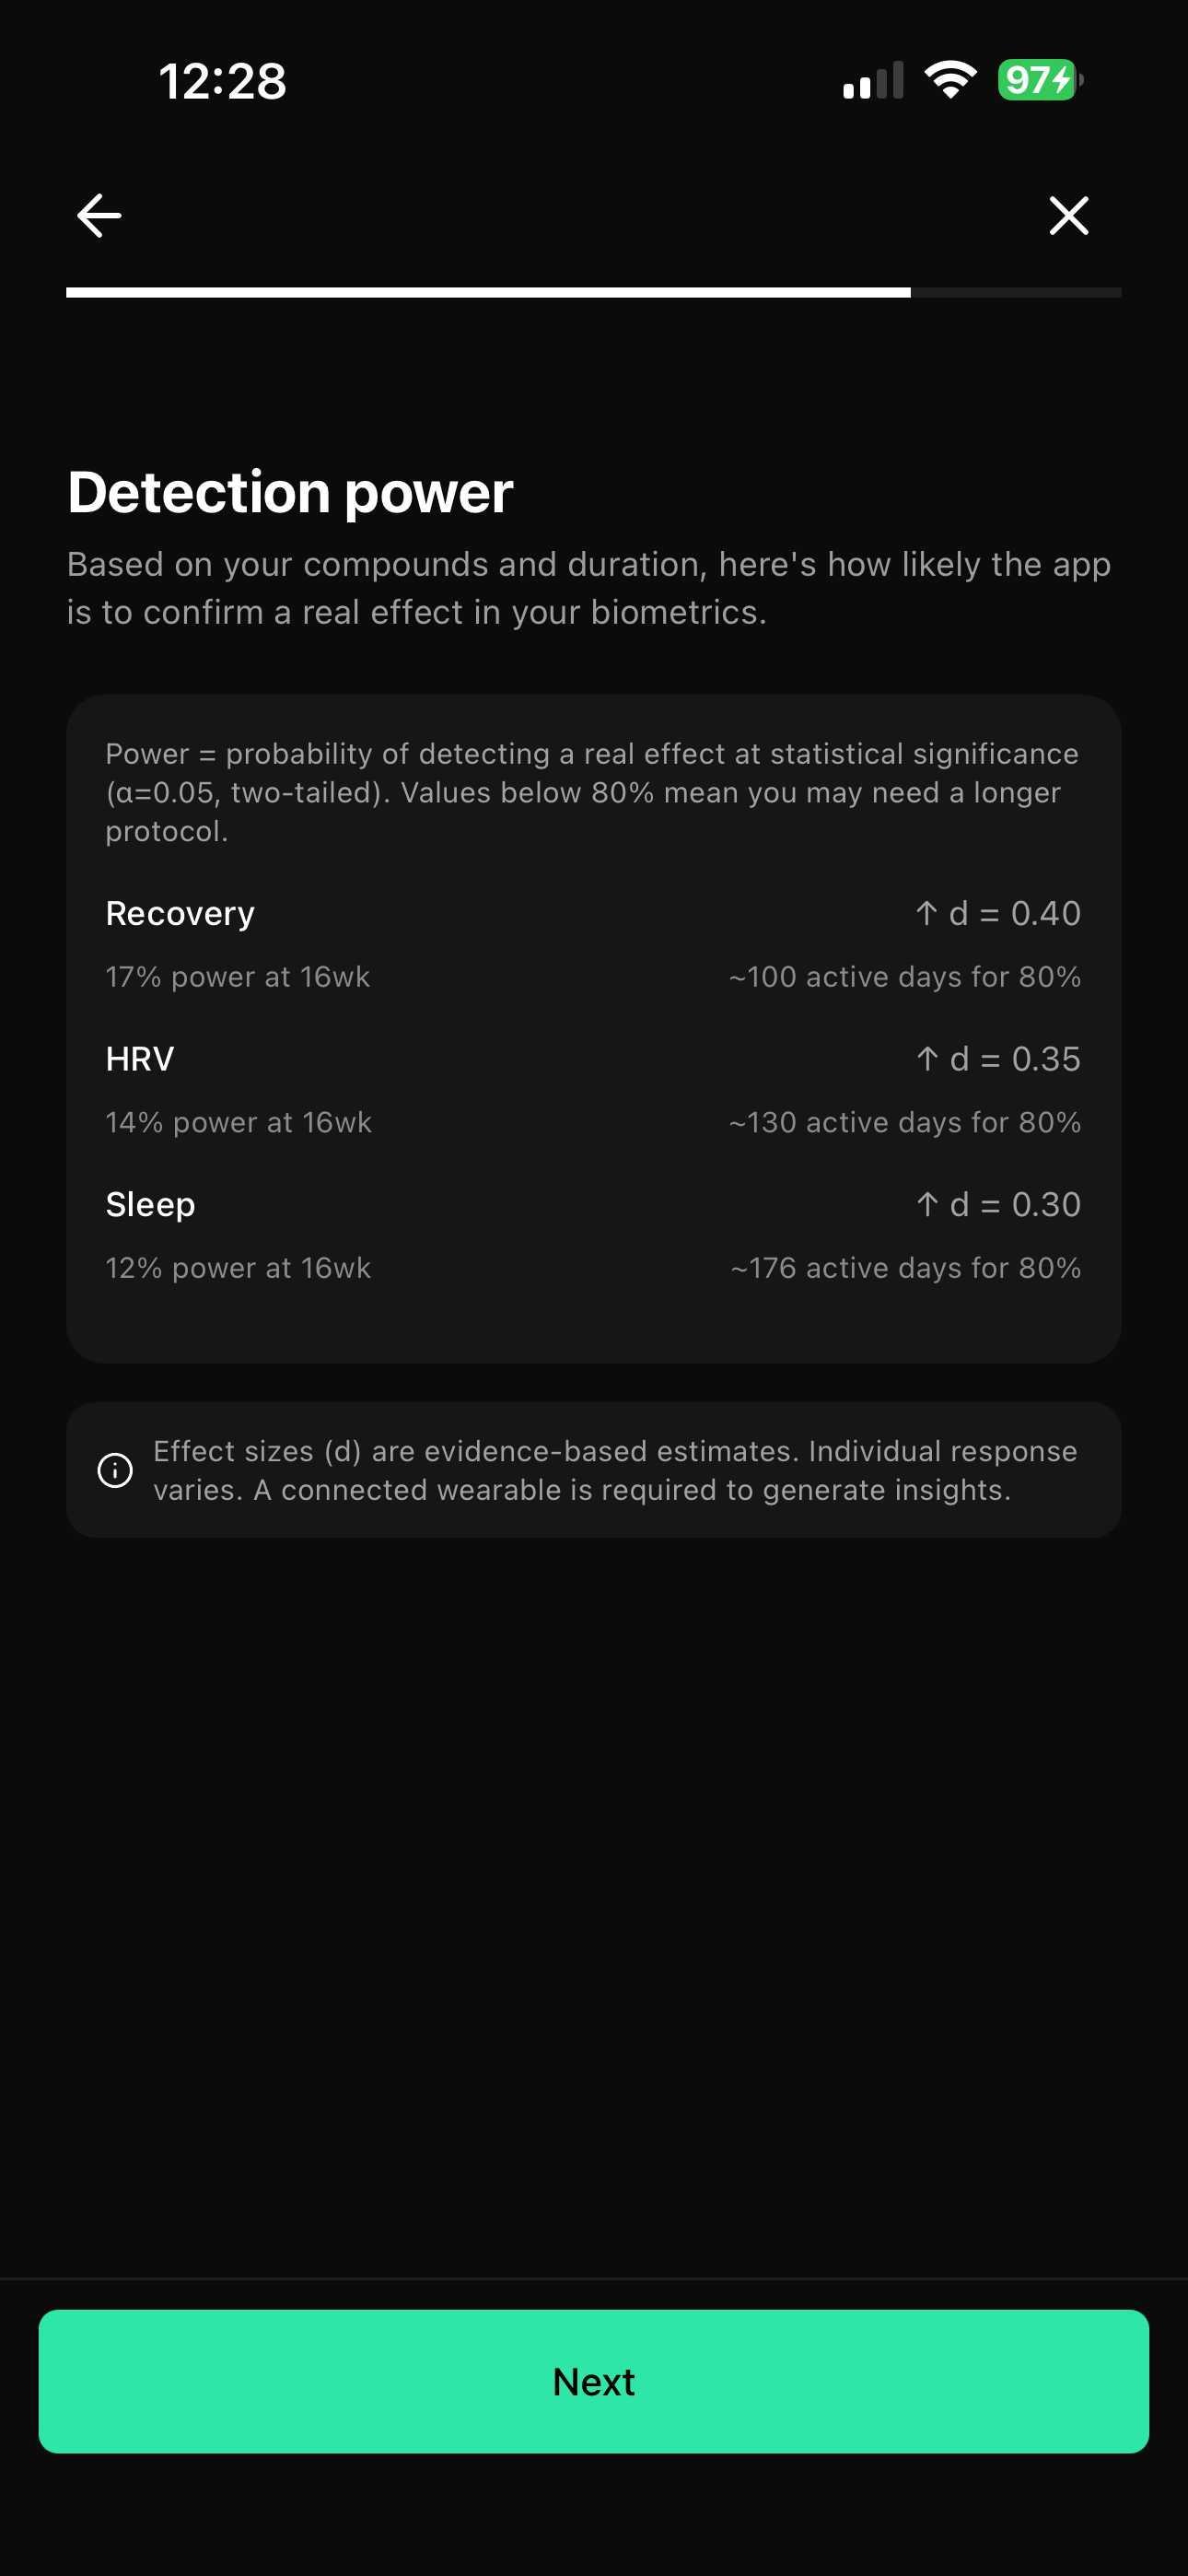
We calculate the probability that your routine is actually working — using your real data.
- Detection probability
- Effect size
- p-value
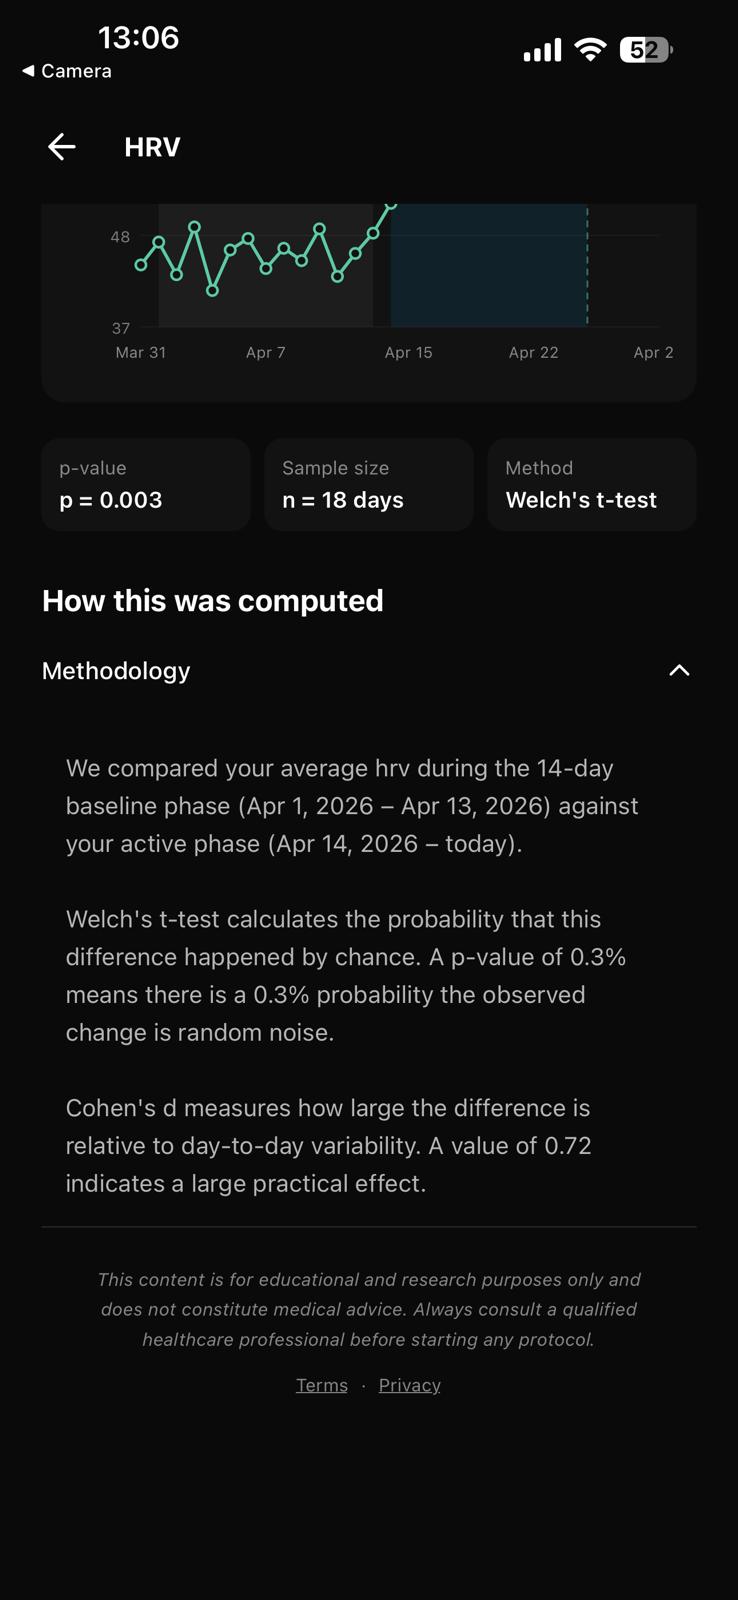
Know what's real.
Compare your baseline vs active phase using proven statistical methods.
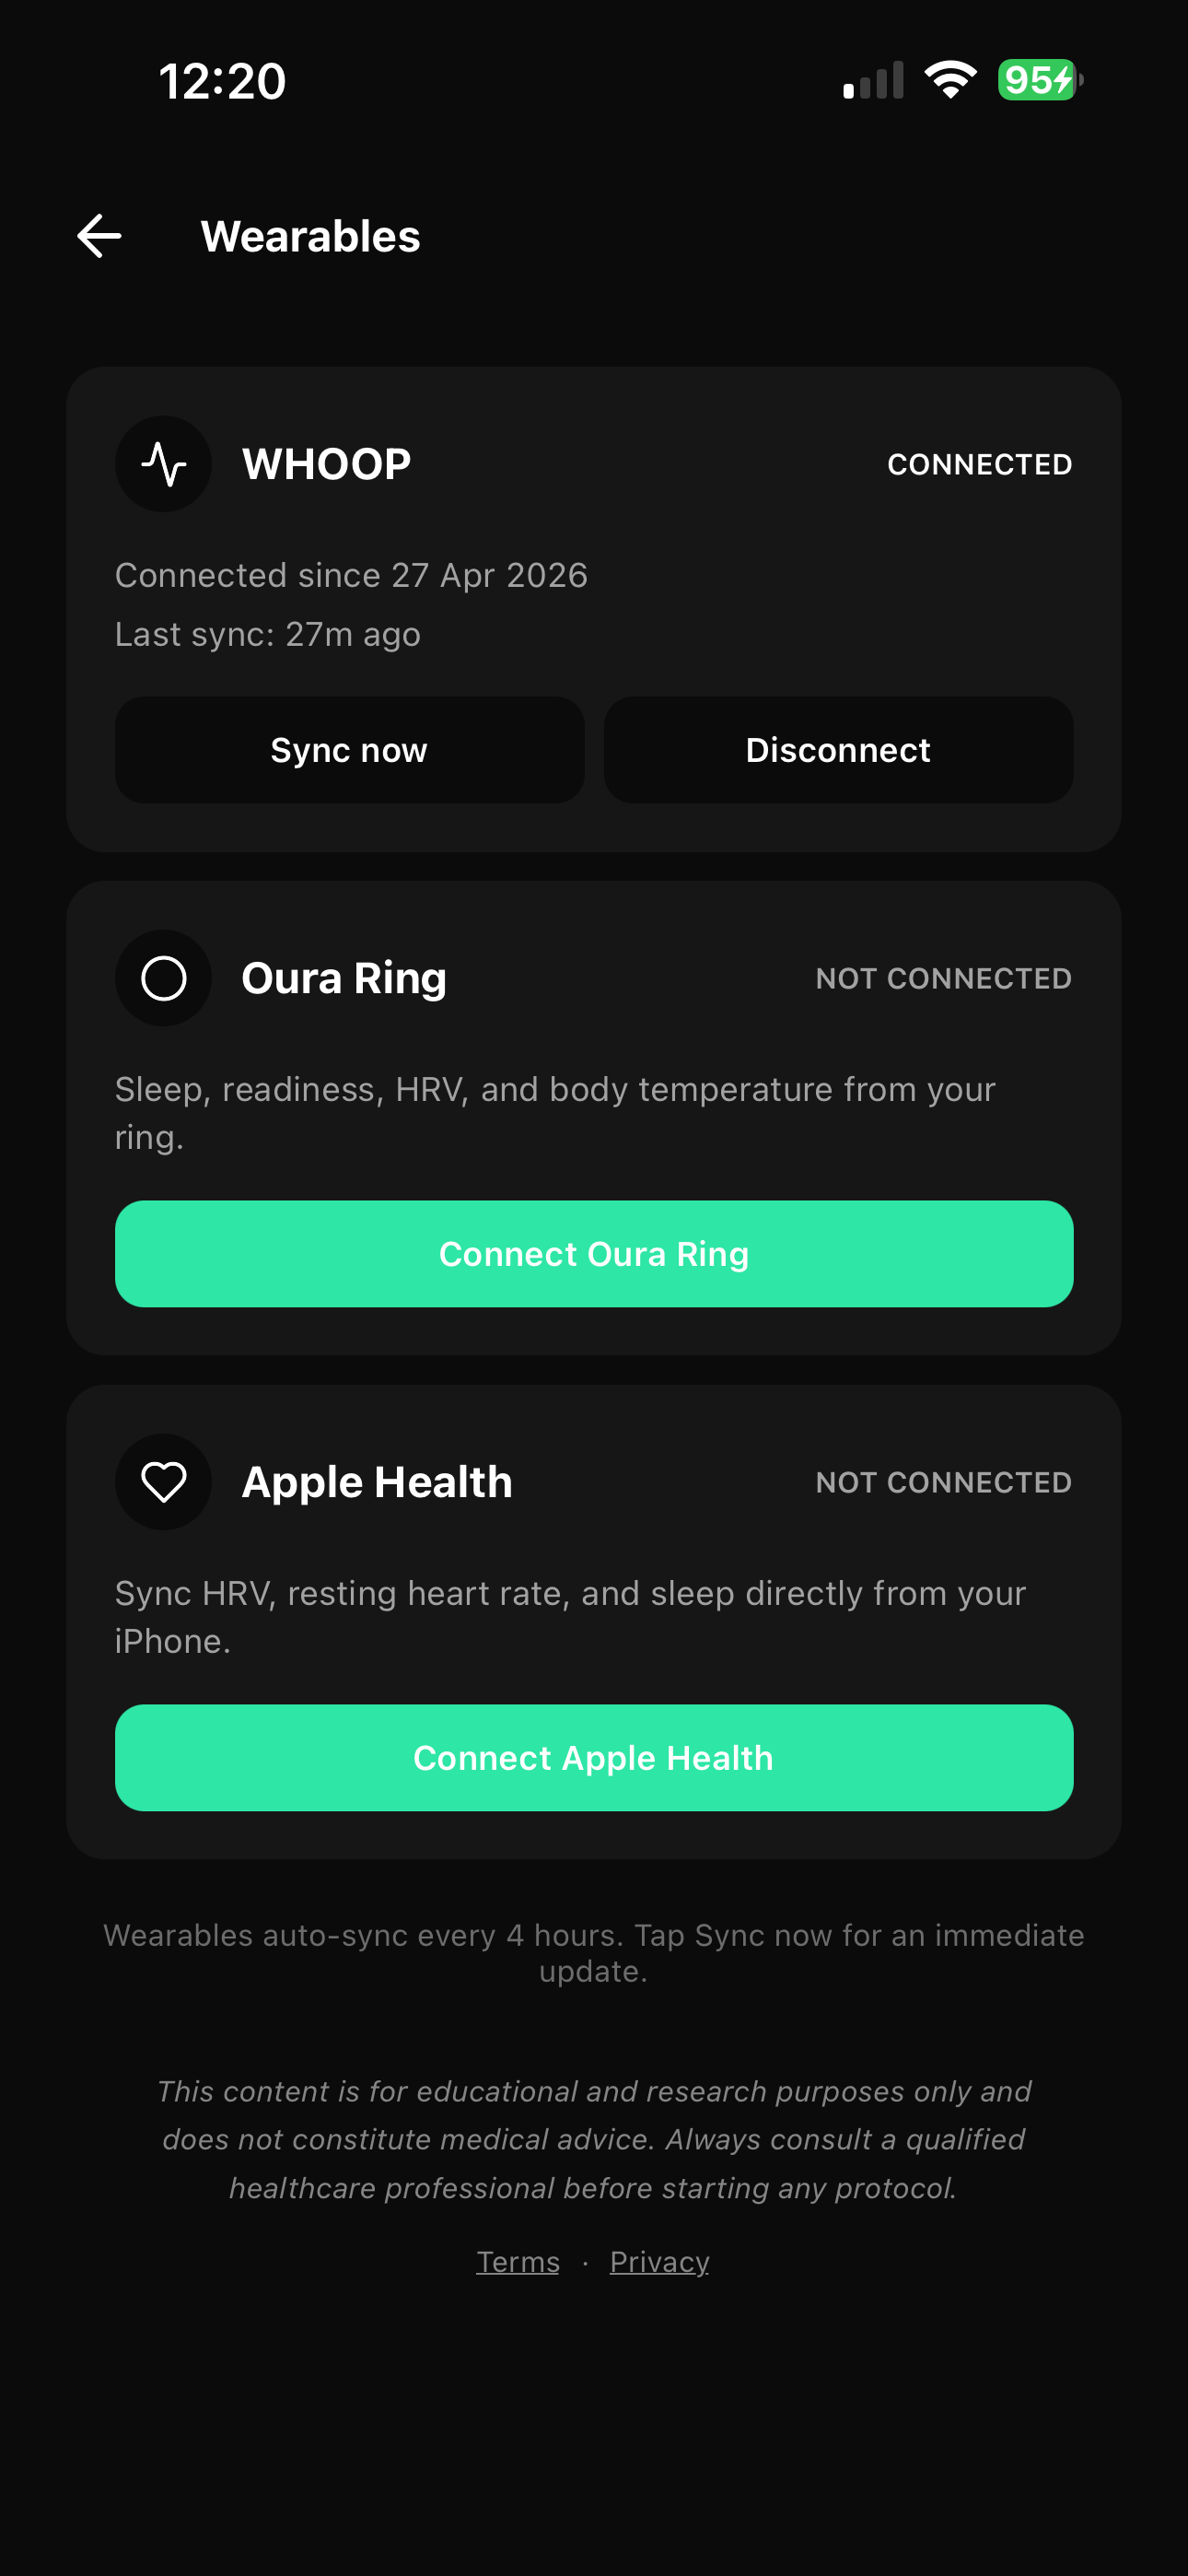
Your wearables, unified.
Whoop, Oura, Apple Health — one feed, one baseline, one source of truth.
Most apps track. We prove.
Show you data.
Charts, numbers, dashboards. You're left guessing whether anything is actually changing.
Tell you if it's real.
We tell you if your actions are actually causing change — with statistical proof.
No complexity. Just results.
No lab knowledge required. No spreadsheets. Just track and let the system do the work.
Stop wasting weeks.
Most routines don't work. Now you'll know which do.
Start seeing what works.
Your body already has the data. Now you can finally understand it.
Takes less than 60 seconds to start